Quantcast
Channel: Phylogenetic Tools for Comparative Biology
Viewing all 800 articles
Browse latest View live

Extracting all subtrees of a given size & larger

$
0
0

An R-sig-phylo query asked the following:

I'd like to sample independent subclades of greater than N tips from a phylogenetic tree much greater than N, say (number of tips >= 10*N). I can extract all subclades of greater than N taxa, but sampling independent subclades seems to be a harder problem.

Well - I'm not completely sure if this what he's asking for, but here is a function that will get all the subtrees in a binary tree that cannot be further subdivided into two subtrees of size >= clade.size.

getCladesofSize<-function(tree,clade.size=2){
  nn<-1:tree$Nnode+length(tree$tip.label)
  ndesc<-function(tree,node){
    x<-getDescendants(tree,node)
    sum(x<=length(tree$tip.label))
  }
  dd<-setNames(sapply(nn,ndesc,tree=tree),nn)
  aa<-nn[1]
  nodes<-vector()
  while(length(aa)){
    bb<-sapply(aa,function(x,tree)
      tree$edge[which(tree$edge[,1]==x),2],tree=tree)
    cc<-matrix(dd[as.character(bb)],nrow(bb),ncol(bb))
    cc[is.na(cc)]<-1
    gg<-apply(cc,2,function(x,cs)
      any(x < cs),cs=clade.size)
    nodes<-c(nodes,aa[gg])
    aa<-as.vector(bb[,!gg])
  }
  trees<-lapply(nodes,extract.clade,phy=tree)
  class(trees)<-"multiPhylo"
  return(trees)
}

The way this works is as follows. First, we get the number of tips descended from each node in the tree:

nn<-1:tree$Nnode+length(tree$tip.label)
ndesc<-function(tree,node){
  x<-getDescendants(tree,node)
  sum(x<=length(tree$tip.label))
}
dd<-setNames(sapply(nn,ndesc,tree=tree),nn)
Next, we conduct a traversal of the tree from the root. If a node has two daughter clades both of size >= clade.size, then we ascend up the tree to those nodes. If not, then we store the value of the current node. At the end, we extract all subtrees whose node numbers we have stored:
trees<-lapply(nodes,extract.clade,phy=tree)
class(trees)<-"multiPhylo"
That's it.

Right now, the function will only work on binary trees - but there is no check to assure that your tree is binary. I will fix that and add to phytools.


Version of getCladesofSize that also works for multifurcating trees

$
0
0

As promised earlier, I have figured out how to allow the function getCladesofSize (which gets all the subtrees of a phylogeny that cannot be further subdivided into two subtrees of size greater in size than a specified value) to allow for multifurcating, as well as strictly binary, trees. The updated code is here; and I have also posted a new version of phytools (phytools 0.2-64), which can be downloaded and installed from source.

Here's a quick demo of what the function does:

> require(phytools)
Loading required package: phytools
> packageVersion("phytools")
[1] ‘0.2.64’
> # a tree with lots of polytomies
> plotTree(tree,fsize=0.6)
> is.binary.tree(tree)
[1] FALSE
> trees<-getCladesofSize(tree,5)
> trees
6 phylogenetic trees
> layout(matrix(1:6,3,2))
> plotTree(trees)
Waiting to confirm page change...

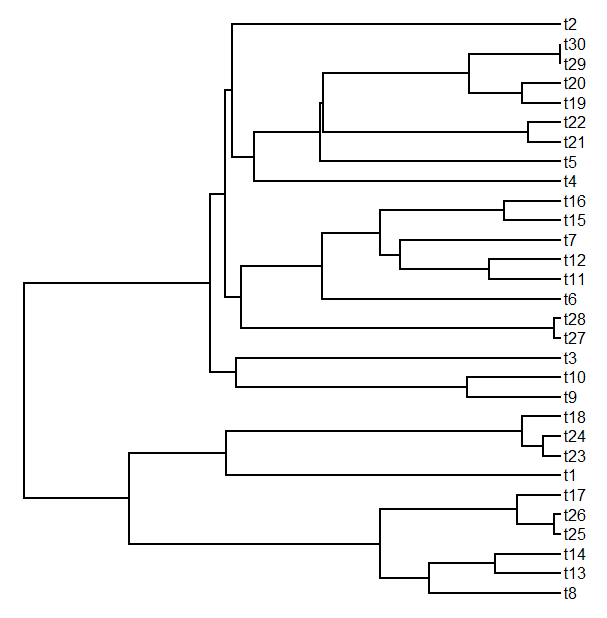
Looking at all the trees - we can see that none can be further subdivided into two (or more, for trees polytomous at the root) reciprocally monophyletic groups all containing (in this case) 5 or more tips. Cool.

extract.clade for tree with a mapped discrete character

$
0
0

A phytools reader recently asked the following via the general comments page:

I have used make.simmap to obtain 1000 stochastic maps for a larger clade. It contains two sister-clades. My main interest is to compare transitions for these two sister-clades. describe.simmap gives average values for the entire clade, while, countSimmap provides number of transitions for 1000 trees. Is there a way to obtain these values individually for sub-clades within phytools, or do I have to run the analyses separately for each sister-clade to obtain these values?

Well, firstly, I would not recommend running stochastic mapping separately for each subtree of interest in your phylogeny - unless you would like to assume that the substitution process for your discrete character is different in different parts of the tree. (Even if it is - unless our subtrees are large then we probably don't have enough information to estimate this difference anyway.) What we'd really like to do is run stochastic mapping on the full tree, and then extract our clades of interest to run describe.simmap on each subtree. Unfortunately - extract.clade from the 'ape' package won't preserve the discrete character mapping on our stochastic mapped tree!

Luckily, there is a solution. phytools does have an analogous function to drop.tip (called drop.tip.simmap), and drop.tip and extract.clade are (in some ways) just the inverse of each other. Let's try to write a mapping compatible version of extract.clade for phylogenies with a mapped discrete character using drop.tip.simmap:

extract.clade.simmap<-function(tree,node){
  x<-getDescendants(tree,node)
  x<-x[x<=length(tree$tip.label)]
  drop.tip.simmap(tree,tree$tip.label[-x])
}

OK, that was easy. Now let's try it:

> Q<-matrix(c(-1,1,1,-1),2,2)
> colnames(Q)<-rownames(Q)<-letters[1:2]
> tree<-sim.history(pbtree(n=100,scale=1),Q)
> cols<-setNames(c("blue","red"),letters[1:2])
> plotSimmap(tree,cols,fsize=0.6,node.numbers=T,lwd=3, pts=F)
Now let's extract the clade descended from node 106 & plot:
> tree106<-extract.clade.simmap(tree,106)
> plotSimmap(tree106,cols,fsize=0.8,lwd=3,pts=F)
Cool.

Note that although the basic functionality is the same, the options and arguments of extract.clade.simmap and extract.cladeare not the same.

New version of phytools on CRAN

$
0
0

A new version of phytools (0.2-70) is now available on CRAN. It can be downloaded & installed from source. Package binaries should be built and percolate through the CRAN mirror repositories over the next few days.

Here's a partial list of updates since the last CRAN version (phytools 0.2-50):

1. A much faster version of read.simmap that addressed a memory allocation issue of earlier versions.

2. Numerous updates to make.simmap (e.g., 1, 2). make.simmap now (optionally) samples from the full (rather than conditional) posterior distribution of substitution rates and discrete character histories, and allows the use to control the prior distribution on the substitution model.

3. A bug fix in fastAnc.

4. Big speed-ups for the function estDiversity and rerootingMethod.

5. Much faster versions of countSimmap, describeSimmap, and getStates.

6. A bug fix & update to the function phylomorphospace.

7. New versions of densityMap and contMap.

8. A new version of rerootingMethod that allows for any symmetric substitution model.

9. A totally new function mergeMappedStates, to multiple mapped states into a single state.

10. A new function getCladesofSize that extracts all reciprocally monophyletic clades from a tree that can't be further subdivided into two (or more) reciprocally monophyletic clades of size n or larger (1, 2).

11. A new function extract.clade.simmap that extracts a clade from the tree while preserving a mapped discrete character.

Plotting the structure of a circular ("fan") tree

$
0
0

Rafael Maia asks:

It would be really cool if simmap and densityMap trees could be plotted as radial (type='fan' in plot.phylo) trees. I find it much easier to visualize the patterns when the tree is quite large.

Indeed this would be quite cool. The first step is to figure out how to plot the structure of a circular tree. Here is my attempt at that. (Note, the function requires plotrix - not presently a phytools dependency.)

plotFan<-function(tree){
  if(!require(plotrix)) stop("install 'plotrix'")
  # reorder
  cw<-reorder(tree)
  pw<-reorder(tree,"pruningwise")
  # count nodes and tips
  n<-length(cw$tip)
  m<-cw$Nnode
  # get Y coordinates on uncurved space
  Y<-vector(length=m+n)
  Y[cw$edge[cw$edge[,2]<=length(cw$tip),2]]<-1:n
  nodes<-unique(pw$edge[,1])
  for(i in 1:m){
    desc<-pw$edge[which(pw$edge[,1]==nodes[i]),2]
    Y[nodes[i]]<-(min(Y[desc])+max(Y[desc]))/2
  }
  Y<-setNames(Y/max(Y)*2*pi,1:(n+m))
  Y<-cbind(Y[as.character(tree$edge[,2])],
    Y[as.character(tree$edge[,2])])
  R<-nodeHeights(cw)
  # now put into a circular coordinate system
  x<-R*cos(Y)
  y<-R*sin(Y)
  # plot nodes
  plot(x,y,axes=FALSE,asp=1)
  # plot radial lines (edges)
  for(i in 1:nrow(cw$edge)) lines(x[i,],y[i,])
  # plot circular lines
  for(i in 1:m+n){
    r<-R[match(i,cw$edge)]
    a1<-min(Y[which(cw$edge==i)])
    a2<-max(Y[which(cw$edge==i)])
    draw.arc(0,0,r,a1,a2)
  }
}

OK - now let's try it out:

> tree<-pbtree(n=30)
> plotTree(tree)
> source("plotFan.R")
> plotFan(tree)

Cool. Well, this is a good start!

Plotting a circular discrete character mapped tree, part II: The colors

$
0
0

Now that we've figured out how to plot the structure of a circular (i.e., "fan") tree, the next step is segmenting our plotted edges by a discrete character & then plotting segment by color. Here's my function for this next step. Note that (again) this depends on the package 'plotrix' and will not work if there is no character mapped on the tree:

plotFan<-function(tree,colors=NULL){
  if(!require(plotrix)) stop("install 'plotrix'")
  # check colors
  if(is.null(colors)){
    st<-sort(unique(unlist(sapply(tree$maps,names))))
    colors<-palette()[1:length(st)]
    names(colors)<-st
    if(length(st)>1){
      cat("no colors provided. ")
      cat("using the following legend:\n")
      print(colors)
    }
  }
  # reorder
  cw<-reorder(tree)
  pw<-reorder(tree,"pruningwise")
  # count nodes and tips
  n<-length(cw$tip)
  m<-cw$Nnode
  # get Y coordinates on uncurved space
  Y<-vector(length=m+n)
  Y[cw$edge[cw$edge[,2]<=length(cw$tip),2]]<-1:n
  nodes<-unique(pw$edge[,1])
  for(i in 1:m){
    desc<-pw$edge[which(pw$edge[,1]==nodes[i]),2]
    Y[nodes[i]]<-(min(Y[desc])+max(Y[desc]))/2
  }
  Y<-setNames(Y/max(Y)*2*pi,1:(n+m))
  Y<-cbind(Y[as.character(tree$edge[,2])],
    Y[as.character(tree$edge[,2])])
  R<-nodeHeights(cw)
  # now put into a circular coordinate system
  x<-R*cos(Y)
  y<-R*sin(Y)
  # plot nodes
  plot(x,y,axes=FALSE,asp=1)
  # plot radial lines (edges)
  for(i in 1:nrow(cw$edge)){
    maps<-cumsum(cw$maps[[i]])/sum(cw$maps[[i]])
    xx<-c(x[i,1],x[i,1]+(x[i,2]-x[i,1])*maps)
    yy<-c(y[i,1],y[i,1]+(y[i,2]-y[i,1])*maps)
    for(i in 1:(length(xx)-1))
      lines(xx[i+0:1],yy[i+0:1],
      col=colors[names(maps)[i]],lwd=2)
  }
  # plot circular lines
  for(i in 1:m+n){
    r<-R[match(i,cw$edge)]
    a1<-min(Y[which(cw$edge==i)])
    a2<-max(Y[which(cw$edge==i)])
    draw.arc(0,0,r,a1,a2,lwd=2,col=
      colors[names(cw$maps[[match(i,cw$edge[,1])]])[1]])
  }
}

The key attributes that I've added is segmentalization of each edge by the mapped state, and then separate plotting of each edge segment according to the colors for the state.

Let's try it out:

> Q<-matrix(c(-1,1,1,-1),2,2)
> rownames(Q)<-colnames(Q)<-letters[1:2]
> Q
   a  b
a -1  1
b  1 -1
> tree<-sim.history(tree,Q)
> plotSimmap(tree,colors=setNames(c("blue","red"), letters[1:2]))
> source("plotFan.R")
> plotFan(tree,colors=setNames(c("blue","red"), letters[1:2]))

Cool. Now we just need to clean it up a bit & add labels....

New version of plotSimmap with type="fan"

$
0
0

Today I posted twice (1, 2) in response to Rafael Maia's early morning query about plotting stochastic mapped trees in a circular style. My earlier posts were about plotting the structure of a circular tree and adding a mapped discrete character using colors.

Well, all that was left was the labels. This is easier said that done. The first challenge was rotating the orientation of the labels to match the angle of their corresponding terminal edge. Here is my code to do that:

# plot labels
for(i in 1:n){
  ii<-which(cw$edge[,2]==i) # find edge
  aa<-Y[ii,2]/(2*pi)*360 # compute angle
  # fix angle & adjust to flip at 90 & 270 deg
  adj<-if(aa>90&&aa<270) c(1,0.5) else c(0,0.5)
  aa<-if(aa>90&&aa<270) 180+aa else aa
  # plot label
  text(x[ii,2],y[ii,2],cw$tip.label[i],srt=aa,adj=adj,
    cex=fsize)
}

The second challenge is making sure that we have a plotting window with enough space for our labels. For this, I stole a trick that I used in the function phenogram and described here.

Code for the new version of plotSimmap is here. I have also posted a new phytools version (phytools 0.2-71). Note that I have not applied all relevant options in plotSimmap to type="fan" yet. This will come in future.

For now - let's check out the version we have. Note that we need to first install the package plotrix.

> require(phytools)
Loading required package: phytools
> packageVersion("phytools")
[1] ‘0.2.71’
> tree<-pbtree(n=50,scale=2)
> Q<-matrix(c(-1,1,1,-1),2,2)
> rownames(Q)<-colnames(Q)<-letters[1:2]
> tree<-sim.history(tree,Q)
> cols<-setNames(c("blue","red"),letters[1:2])
> plotSimmap(tree,cols,type="fan")
Note: type='fan' is in development. Most options not yet available.

A miracle - it works!

Creating a type="fan" densityMap or contMap plot

$
0
0

I have not yet added the "type" argument to functions densityMap or contMap; however it is already possible to create a circular densityMap or contMap style tree. Here's how:

> require(phytools)
Loading required package: phytools
> packageVersion("phytools")
[1] ‘0.2.71’
> # simulate tree & data
> tree<-pbtree(n=100,scale=1)
> x<-fastBM(tree)
> # first plot typical contMap & obtain "contMap" object
> XX<-contMap(tree,x) # we don't care about this one
> # now plot with type="fan"
> plotSimmap(XX$tree,XX$cols,type="fan")
Note: type='fan' is in development. Most options not yet available.
> # finally, add color bar
> # (we have to click where we want this)
> add.color.bar(0.8,cols=XX$cols,title="trait value", lims=range(x),digits=2)

Note that we have to click where we want to put the color bar/legend.

That's it.


Raster image files from circular trees in R

$
0
0

There is some noticeablealiasing in circular (type="fan") trees exported directly from R in a raster format such as .png or .jpg. This can be overcome by exporting instead in a lossless vector format such as .pdf or .eps.

For example, here is a circular contMap style tree exported from R as a .png:

(Click for highest resolution version.)

Whereas here is the same tree exported as a .pdf, then read into Illustrator & exported as a much higher quality .jpg (a raster graphic format):

(Click for highest resolution version.)

Some minor improvements to plotSimmap(...,type="fan") and a few other updates

$
0
0

I just posted a new version of plotSimmap and a new minor phytools version (phytools 0.2-74). The updates mainly do the following: (1) allows user control over close to the full range of plotting options in from plotSimmap(..., type="phylogram"); (2) change the shape of the line caps from round to square (to bring into alignment with plotSimmap(...,type="phylogram") and common sense); (3) improve the alignment of labels with the terminal edge their offset from the tips; and, finally, (4) fix some problems where not enough space was left around the plotted trees to allow the labels to be added (this also seems to affect plot.phylo(...,type="fan")).

The result looks very nice. Here's a quick demo using the phylogeny of 100 Greater Antillean anoles from Mahler et al. (2010) and a stochastic mapping of "ecomorph class" (including non-ecomorph species) on the tree. leg gives the color→ecomorph translation.

> require(phytools)
Loading required package: phytools
> packageVersion("phytools")
[1] ‘0.2.74’
> data(anoletree) # load tree
> states<-sort(unique(getStates(anoletree))) # get states
> # set color legend
> leg<-setNames(palette()[1:7],c(states[3],states[-3]))
> leg
Non-    CG    GB       TC     TG     Tr        TW
"black" "red" "green3" "blue" "cyan" "magenta" "yellow"
> # ok - here is a trick to plot an outline around the tree
> par(col="white")
> plotTree(anoletree,type="fan",lwd=4,mar=rep(0,4), fsize=0.8)

Note: type="fan" is in development.
Many options of type="phylogram" are not yet available.

> par(col="black")
> plotSimmap(anoletree,leg,type="fan",lwd=2,mar=rep(0,4), add=TRUE,fsize=0.8)

Note: type="fan" is in development.
Many options of type="phylogram" are not yet available.


(Click for highest resolution.)

Cool.

I also now allow type="fan" trees to be plotted from plotTree, which uses plotSimmap internally.

Minor fixes to plotSimmap

$
0
0

I just fixed a couple of very minor issues with plotSimmap(...,type="fan"): specifically, lwd was not properly controlling the line width of edges; and ftype="off" (which should turn the labels off) was not working. The fixed function version of is here, along with a new minor phytools build (phytools 0.2-75).

We might want to turn off the labels if we have, for instance, a very large tree:

Click for larger version.

That's it for now.

Circular trees in densityMap and contMap

$
0
0

In an earlier post I showed how plotSimmap(...,type="fan") could be used to plot densityMap or contMap style plots using the object of class "densityMap" or "contMap" returned invisibly by each function, respectively.

Well, I have now build this directly into contMap&densityMap (and the S3 generic plot for objects of class "densityMap" and "contMap"). Check it out:

> require(phytools)
Loading required package: phytools
> packageVersion("phytools")
[1] ‘0.2.76’
> contMap(tree,x,type="fan",fsize=0.9)
> X<-densityMap(mtrees,outline=TRUE,fsize=0.9)
sorry - this might take a while; please be patient

Argh - way too cluttered. Let's try a circular tree instead!

> class(X)
[1] "densityMap"
> plot(X,type="fan",fsize=0.9,outline=TRUE)

Since these updates involved changes to a number of methods in phytools - the best bet is to update to the latest non-CRAN phytools build (phytools 0.2-76).

That's it.

Bug fix in make.simmap(...,Q="mcmc")

$
0
0

I just posted a new version of make.simmap and a new phytools build (phytools 0.2-77). This version fixes a bug affecting make.simmap(...,Q="mcmc"). In this method, the transition matrix Q is sampled from its Bayesian posterior probability distribution using MCMC given the model & data. This sample is then used by make.simmap to map characters on the tree.

The bug was not in the MCMC itself which (so far as I can tell) is properly designed, but in how Q was stored in sampling generations - specifically, the updated value of Qfor that generation was always stored. The reason this is not a bug in the MCMC is because this value was only returned to the chain with probability equal to the posterior odds ratio - thus this is only about the value that is stored from the chain, not the behavior of the chain itself. This was somewhat difficult to detect because it will not be obvious unless the variance on the proposal distribution is high relative to the curvature of the likelihood surface or the prior density. (In case it's not obvious why this is, this is because if the proposal variance is low - most post burn-in samples will have relatively high posterior odds and will thus have a good chance of being accepted; whereas if the proposal variance is high, most samples will have low posterior odds.)

I also changed the starting value of Q for the MCMC. Previously, I had arbitrarily set all the non-diagonal elements of Q to a fixed constant. Now I draw a set of values at random from the prior probability density on Q, as provided by the user. The advantage of this is because if we set a very strong prior on Q, our MCMC may have difficulty converging on the region of high posterior density if the variance on our proposal distribution is too low or (especially) high.

I'm not sure what a good proposal variance is - but one way of thinking about it is relative to the empirical Q. For instance, if the non-diagonal of our empirical Q are all around ~0.1, then it is probably not a good idea to vQ = 10. Unless our data contain very little information about Q, almost all samples will be rejected and the MCMC will be very inefficient at exploring the posterior distribution of Q. Conversely, if the non-diagonal of our empirical Q average > 100, then we should probably not choose vQ = 0.001. In this case, if we start anywhere near the ML of Q - and unless we have very little information about Q in our data - almost all samples will be accepted, which is also a bad way to sample from the posterior using MCMC.

Even though make.simmap is not set up for this, it is possible to do some diagnoses on our MCMC using the MCMC diagnostics package coda. For example, let's say we have obtained 100 samples of Q (and thus 100 stochastic mapped trees) from the posterior after burnin

mtrees<-make.simmap(tree,x,Q="mcmc",vQ=0.01,prior= list(use.empirical=TRUE,beta=2))
we can get the likelihoods using
logL<-sapply(unclass(mtrees),function(x) x$logL)
or (for instance), the posterior sample of Q1,2 using
q12<-sapply(unclass(mtrees),function(x) x$Q[1,2])
and then perform diagnostics (effective size, rejection rate, etc.) using the appropriate coda functions. To increase effective size without increasing the number of sampled trees, we can increase the sample frequency (samplefreq) and increase or decrease the proposal variance (vQ).

New CRAN version of phytools

$
0
0

There is a new version of phytools (phytools 0.2-80) now available on CRAN. It will probably take a few days for the Mac OS & Windows binaries to be compiled and to percolate through the mirror repositories.

Relative to the most recent CRAN build of phytools (phytools 0.2-70), this version has only a couple of significant updates, as follows:

1. A bug fix in make.simmap(..., type="mcmc"), described here.

2. The addition of the option to plot trees in a circular (type="fan") style to plotSimmap, plotTree, contMap, and densityMap (described here: 1, 2, 3, 4, 5, 6, 7, and 8).

Check it out.

On the annoying task of adding a legend to a plotted stochastic mapping tree

$
0
0

Today (actually yesterday, now) - in part because I've committed to writing this book chapter on plotting comparative data - I undertook the task of figuring out how to add a color legend to a plotted stochastic mapped tree.

The idea sounds simple enough. We basically want to plot two things: boxes filled according to our translation table from state to color on the stochastic mapped tree; and labels for each of those boxes. We just need to figure out how to space the boxes and the labels so that the result looks good reliably and so the legend is easy enough to consume.

This is complicated by the different places to which we might like to add our legend. So, for instance - in circular trees (type="fan") it probably makes sense to have a vertical legend - filling the whitespace in any of the four corners of the plot. By contrast - in a square right or left facing phylogram (type="phylogram") it probably makes sense to have a horizontal legend.

This is not in phytools yet as I'm working out the kinks, but here is my add-legend code:

add.simmap.legend<-function(leg=NULL,colors,prompt=TRUE, vertical=TRUE,...){
  if(prompt){
    cat("Click where you want to draw the legend\n")
    x<-unlist(locator(1))
    y<-x[2]
    x<-x[1]
  } else {
    if(hasArg(x)) x<-list(...)$x
    else x<-0
    if(hasArg(y)) y<-list(...)$y
    else y<-0
  }
  if(hasArg(fsize)) fsize<-list(...)$fsize
  else fsize<-1.0
  if(is.null(leg)) leg<-names(colors)
  h<-fsize*strheight(leg[1])
  w<-h*(par()$usr[2]-par()$usr[1])/(par()$usr[4]-
   par()$usr[3])
  if(vertical){
    y<-y-0:(length(leg)-1)*1.5*h
    x<-rep(x+w/2,length(y))
    symbols(x,y,squares=rep(w,length(x)),bg=colors,
     add=TRUE,inches=FALSE)
    text(x+w,y,leg,pos=4,cex=fsize)
  } else {
    sp<-fsize*max(strwidth(leg))
    x<-x-w/2+0:(length(leg)-1)*1.5*(sp+w)
    y<-rep(y+w/2,length(x))
    symbols(x,y,squares=rep(w,length(x)),bg=colors,
     add=TRUE,inches=FALSE)
    text(x,y,leg,pos=4,cex=fsize)
  }
}

I decided that I would use boxes of height & width equal to the legend labels, which I can compute using strheight. However things got slightly complicated when I realized that because symbols(...,squares) takes the symbol side length in the x axis units, I would have to first translate between x&y units as follows:

h<-fsize*strheight(leg[1])
w<-h*(par()$usr[2]-par()$usr[1])/(par()$usr[4]-
 par()$usr[3])

The final complication is the plotSimmap(...,type="phylogram") (the default) leaves literally no space for a plotted legend in the plotting window. This we can address by first creating a plotting window that is larger than would be opened by plotSimmap and then using plotSimmap(...,add=TRUE).

Ok, here's a demo:

> # load phytools
> require(phytools)
Loading required package: phytools
> packageVersion("phytools")
[1] ‘0.2.80’
> # load data for example
> data(anoletree)
> # prune to only 'ecomorph' species
> x<-getStates(anoletree,"tips")
> tree<-drop.tip.simmap(anoletree,names(x)[which(x=="Non-")])
> x<-getStates(tree,"tips")
> # do stochastic mapping
> ecomorph.trees<-make.simmap(tree,x,nsim=100,model="ER")
make.simmap is sampling character histories conditioned on the transition matrix
Q =
...
(estimated using likelihood);
and (mean) root node prior probabilities
pi =
      CG        GB        TC        TG        Tr        TW 0.1666667 0.1666667 0.1666667 0.1666667 0.1666667 0.1666667
Done.
> # plot tree type="fan"
> plotSimmap(ecomorph.trees[[1]],type="fan",lwd=3)
no colors provided. using the following legend:
      CG        GB        TC        TG        Tr        TW
  "black"    "red"  "green3"    "blue"    "cyan" "magenta"

Note: type="fan" is in development.
Many options of type="phylogram" are not yet available.

> source("add.simmap.legend.R") # load source
> # add legend
> add.simmap.legend(leg=sort(unique(x)),
colors=palette()[1:6])
Click where you want to draw the legend

And now for the slightly more complicated case of plotSimmap(..., type="phylogram"):

> # first create plotting area
> plot.new(); par(mar=rep(0.1,4))
> par(usr=c(-0.04,1.04,-5,1.04*length(tree$tip.label)))
> # plot tree
> plotSimmap(ecomorph.trees[[5]],lwd=3,pts=FALSE,add=TRUE, fsize=0.7)
no colors provided. using the following legend:
      CG        GB        TC        TG        Tr        TW
  "black"    "red"  "green3"    "blue"    "cyan" "magenta"
> # finally, add legend
> colors<-setNames(palette()[1:6],sort(unique(x)))
> add.simmap.legend(colors=colors,vertical=FALSE)
Click where you want to draw the legend

That looks ok.


plotSimmap(...,type="phylogram") now compatible with nodelabels() in ape

$
0
0

I have just posted a new version of the phytools function plotSimmap (and a new phytools package version, phytools 0.2-82) that can be compatible with the ape functions nodelabels, edgelabels, and tiplabels. This is accomplished by setting the environmental variable "lastplot.phylo" in the environment .PlotEnvPhylo following the ape convention. This environmental variable is a list containing all the information used by nodelabels and similar to identify the location of nodes in the current plotting window.

This is a little experimental - but let's try it out:

> # tree is a stochastic map for the anole
> # ecomorph tree
> plotSimmap(tree,pts=FALSE,lwd=3,fsize=0.7,setEnv=TRUE)
no colors provided. using the following legend:
      CG        GB        TC        TG        Tr        TW
  "black"    "red"  "green3"    "blue"    "cyan" "magenta"
setEnv=TRUE is experimental. please be patient with bugs
> nodelabels(cex=0.7)

We can also do leftward facing trees:

> plotSimmap(tree,pts=FALSE,lwd=3,fsize=0.7,setEnv=TRUE, direction="leftwards")
no colors provided. using the following legend:
      CG        GB        TC        TG        Tr        TW
  "black"    "red"  "green3"    "blue"    "cyan" "magenta"
setEnv=TRUE is experimental. please be patient with bugs
> nodelabels(cex=0.7)

One handy use of this might be to plot the posterior probabilities of each node as a pie chart on top of one example stochastic map. (I coerced nodelabels into doing that here, but this is much neater.) For example:

> # trees is 100 stochastically mapped trees
> # get the posterior probs from our sample
> PP<-describe.simmap(trees,message=FALSE)$ace
> # let's leave space for a legend
> plot.new(); par(mar=rep(0.1,4))
> par(usr=c(-0.04,1.04,-5,1.04*length(tree$tip.label)))
> # set colors
> cols<-setNames(palette()[1:6],sort(unique(getStates(tree,"tips"))))
> # plot
> plotSimmap(tree,cols,lwd=2,pts=FALSE,add=TRUE,fsize=0.7, setEnv=TRUE)
setEnv=TRUE is experimental. please be patient with bugs
> nodelabels(pie=PP,piecol=palette()[1:6],cex=0.6)
> add.simmap.legend(colors=cols,vertical=FALSE)
Click where you want to draw the legend
Click for larger version.

That's pretty cool, I think.

New version of findMRCA

$
0
0

I just posted a new version of findMRCA. This function finds the most recent common ancestor (MRCA) for a set of taxa. Now it can instead (optionally) return the height above the root of the MRCA of a set of taxa.

This version is in a new phytools build (phytools 0.2-83), which many users will be able to download & install from source.

This update is mainly to address the need of a phytools user. The previous version worked fine, so far as I know.

Simple tree plotter

$
0
0

As I mentioned in a prior post I am writing a book chapter on visualization for phylogenetic comparative biology. As I component of this, I discuss the basics of plotting a couple of different types of phylogenetic trees, including some instruction on programming these methods.

For one component of this I wrote a simplified tree plotting function in R. This is what it looks like. Excluding annotation, the function code is less than 20 lines:

simpleTreePlot<-function(tree){
  n<-length(tree$tip.label)
  # reorder cladewise to assign tip positions
  cw<-reorder(tree,"cladewise")
  y<-vector(length=n+cw$Nnode)
  y[cw$edge[cw$edge[,2]<=n,2]]<-1:n
  # reorder pruningwise for post-order traversal
  pw<-reorder(tree,"pruningwise")
  nn<-unique(pw$edge[,1])
  # compute vertical position of each edge
  for(i in 1:length(nn)){
    yy<-y[pw$edge[which(pw$edge[,1]==nn[i]),2]]
    y[nn[i]]<-mean(range(yy))
  }
  # compute start & end points of each edge
  X<-nodeHeights(cw)
  # open & size a new plot
  plot.new(); par(mar=rep(0.1,4))
  plot.window(xlim=c(0,1.1*max(X)),ylim=c(0,max(y)+1))
  # plot horizontal edges
  for(i in 1:nrow(X))
    lines(X[i,],rep(y[cw$edge[i,2]],2),lwd=2,lend=2)
  # plot vertical relationships
  for(i in 1:tree$Nnode+n)
    lines(X[which(cw$edge[,1]==i),1],
    range(y[cw$edge[which(cw$edge[,1]==i),2]]),lwd=2,
    lend=2)
  # plot tip labels
  for(i in 1:n)
    text(X[which(cw$edge[,2]==i),2],y[i],tree$tip.label[i],
    pos=4,offset=0.1)
}

Try it out:

> require(phytools)
Loading required package: phytools
> tree<-pbtree(b=1,d=0.2,n=30)
> simpleTreePlot(tree)

Any suggestions?

Even simpler phylomorphospace

$
0
0

As I mentioned yesterday, I'm working a book chapter on PCM visualization methods. A very small section of that chapter gives an introduction to programming such methods in R. To that end I described a simplified tree plotting function. Here is code for a simplified phylomorphospace plotting function. It needs phytools (and dependencies) and calibrate.

simplePhylomorphospace<-function(tree,x,y){
  n<-length(tree$tip.label)
  # get the x & y coordinates of all the tips & nodes
  x<-c(x[tree$tip.label],fastAnc(tree,x))
  y<-c(y[tree$tip.label],fastAnc(tree,y))
  # plot tips
  plot(x[1:n],y[1:n],cex=1.25,pch=21,bg="black",xlab="x",
   ylab="y")
  # plot nodes
  points(x[1:tree$Nnode+n],y[1:tree$Nnode+n],cex=1,pch=21,
   bg="black")
  # plot lines
  apply(tree$edge,1,function(edge,x,y) lines(x[edge],
   y[edge]),x=x,y=y)
  # add tip labels (requires 'calibrate')
  textxy(x[1:n],y[1:n],tree$tip.label)
}
(Just seven lines of code, excluding comments.)

Let's see how it works:

> require(phytools)
Loading required package: phytools
> require(calibrate)
Loading required package: calibrate
> source("simplePhylomorphospace.R")
> tree<-pbtree(n=30)
> x<-fastBM(tree)
> y<-fastBM(tree)
> simplePhylomorphospace(tree,x,y)

Overlaying a posterior density map from stochastic mapping on your phylomorphospace

$
0
0

Thinking about phylomorphospaces for the first time in a bit last night, when I realized that we can now use phytools to pretty easily overlay a posterior density map from stochastic mapping (e.g., here) onto a projection of the tree into two dimensional morphospace - i.e., a phylomorphospace plot (e.g., here). This is how we do it.

First, for the purposes of demonstration, let's simulate some data with a high rate & correlation between x&y when our simulated discrete character is in the derived state '1', and a low rate & correlation when in the ancestral state '0':

> # simulate tree & data
> Q<-matrix(c(-1,1,1,-1),2,2)
> rownames(Q)<-colnames(Q)<-c(0,1)
> tree<-sim.history(pbtree(n=40,scale=1),Q,anc="0")
> R<-list(matrix(c(1,0,0,1),2,2),matrix(c(2,1.8,1.8,2), 2,2))
> names(R)<-c(0,1)
> X<-sim.corrs(tree,R)
> colnames(X)<-c("x","y")

Next, let's conduct empirical Bayes stochastic mapping & then generate a posterior density map:

> # Ok, now do stochastic character mapping
> mtrees<-make.simmap(tree,tree$states,nsim=100, message=FALSE)
> # densityMap
> dmap<-densityMap(mtrees)
sorry - this might take a while; please be patient

Finally, let's overlay the density map on our phylomorphospace plot:

> phylomorphospace(dmap$tree,X,colors=dmap$cols, node.by.map=TRUE,xlim=c(-1.7,2))
> add.simmap.legend(colors=setNames(c(dmap$cols[1], dmap$cols[length(dmap$cols)]),c(0,1)))
Click where you want to draw the legend

Pretty cool.

Viewing all 800 articles
Browse latest View live