Rafael Maia asks:
It would be really cool if simmap and densityMap trees could be plotted as radial (type='fan' in plot.phylo) trees. I find it much easier to visualize the patterns when the tree is quite large.
Indeed this would be quite cool. The first step is to figure out how to plot the structure of a circular tree. Here is my attempt at that. (Note, the function requires plotrix - not presently a phytools dependency.)
plotFan<-function(tree){
if(!require(plotrix)) stop("install 'plotrix'")
# reorder
cw<-reorder(tree)
pw<-reorder(tree,"pruningwise")
# count nodes and tips
n<-length(cw$tip)
m<-cw$Nnode
# get Y coordinates on uncurved space
Y<-vector(length=m+n)
Y[cw$edge[cw$edge[,2]<=length(cw$tip),2]]<-1:n
nodes<-unique(pw$edge[,1])
for(i in 1:m){
desc<-pw$edge[which(pw$edge[,1]==nodes[i]),2]
Y[nodes[i]]<-(min(Y[desc])+max(Y[desc]))/2
}
Y<-setNames(Y/max(Y)*2*pi,1:(n+m))
Y<-cbind(Y[as.character(tree$edge[,2])],
Y[as.character(tree$edge[,2])])
R<-nodeHeights(cw)
# now put into a circular coordinate system
x<-R*cos(Y)
y<-R*sin(Y)
# plot nodes
plot(x,y,axes=FALSE,asp=1)
# plot radial lines (edges)
for(i in 1:nrow(cw$edge)) lines(x[i,],y[i,])
# plot circular lines
for(i in 1:m+n){
r<-R[match(i,cw$edge)]
a1<-min(Y[which(cw$edge==i)])
a2<-max(Y[which(cw$edge==i)])
draw.arc(0,0,r,a1,a2)
}
}
OK - now let's try it out:
> tree<-pbtree(n=30)
> plotTree(tree)
> plotTree(tree)
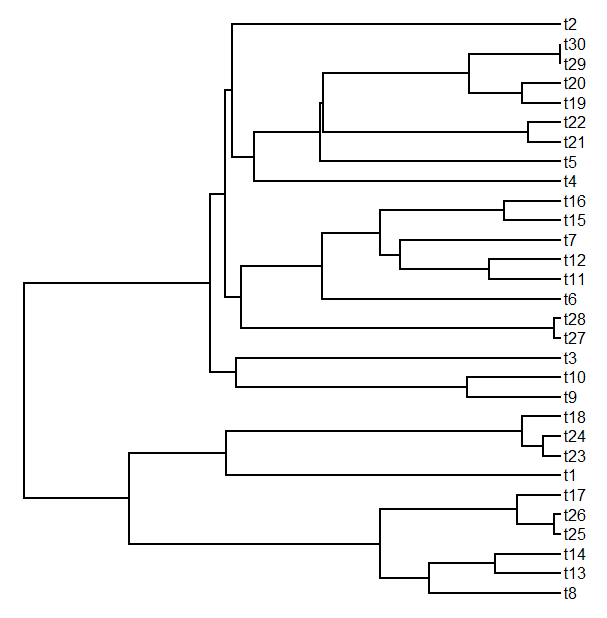
> source("plotFan.R")
> plotFan(tree)
> plotFan(tree)

Cool. Well, this is a good start!